Methodology
The initial methodology for this project was primarily designed around a GIS based tool called VORIS (VOlcanic Risk Information System) used to generate volcanic risk scenarios and hazard maps for different volcanic hazards based on numerical simulations of the hazards. However after many attempts at processing the researched data using the tool, it was decided that other methods would need to be used to produce a map that more correctly represents that hazards associated with Yellowstone National Park.
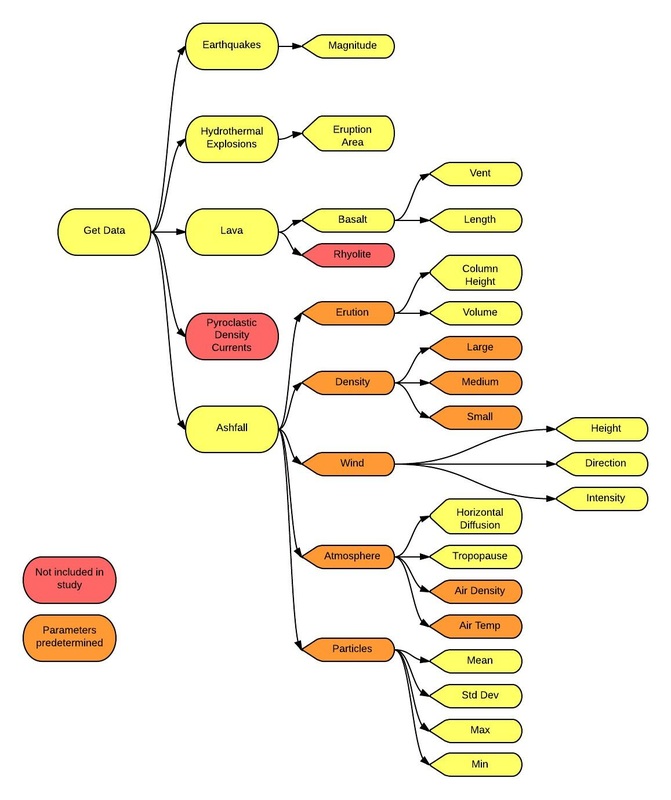
Volcanic hazards and associated parameters using VORIS tool
Steps taken to produce hazard map of Yellowstone National Park without using VORIS hazard tool
Data
The data for this project was collected from a number of sources however the primary resource was the Wyoming State Geological survey.
|
USGS National Map
WSGS Yellowstone Teton Epicentre |
DEM
National Park Boundaries Geology Faults Caldera Boundaries Bathymetry of Yellowstone Lake Geothermal Areas Waterbodies Historic Earthquakes Hydrothermal Explosions Basaltic Vents |
Once all of the relevant data was collected from the different sources, the batch project tool was used to ensure that the entire data set was set up in the same projection and co-ordinate system.
ArcToolbox > Data Management Tools > Projections and Transformations > Define Projection > Batch
ArcToolbox > Data Management Tools > Projections and Transformations > Define Projection > Batch
DEM
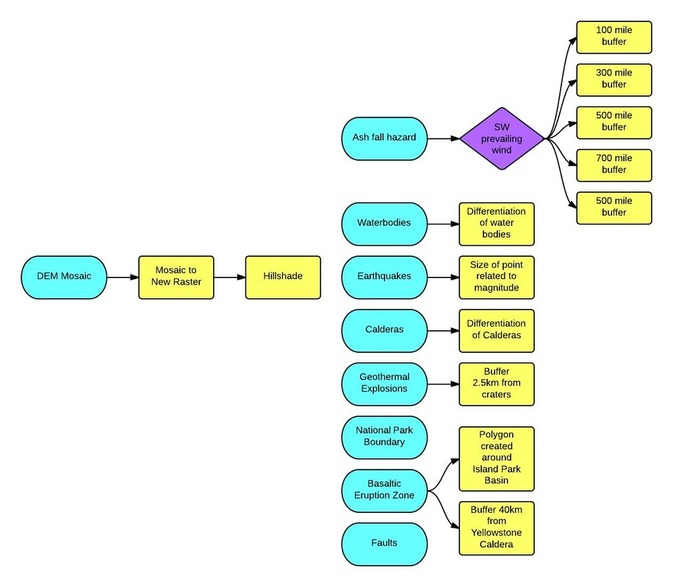
From the USGS National Map nine individual mosaics were downloaded detailing elevation information for Yellowstone National Park and the surrounding area. The nine tiles were combined into one DEM raster layer using the Data Management Tool, Mosaic to New Raster.
ArcToolbox > Data Management Tools > Raster > Raster Dataset > Mosaic to new raster
From the newly created DEM layer a hillshade layer was added to create shaded relief of the surface.
ArcToolbox > Data Management Tools > Raster > Raster Dataset > Mosaic to new raster
From the newly created DEM layer a hillshade layer was added to create shaded relief of the surface.
Using the DEM base map six separate maps were produced detailing the major hazards associated with Yellowstone National Park.
- Historic Earthquake Distribution Map
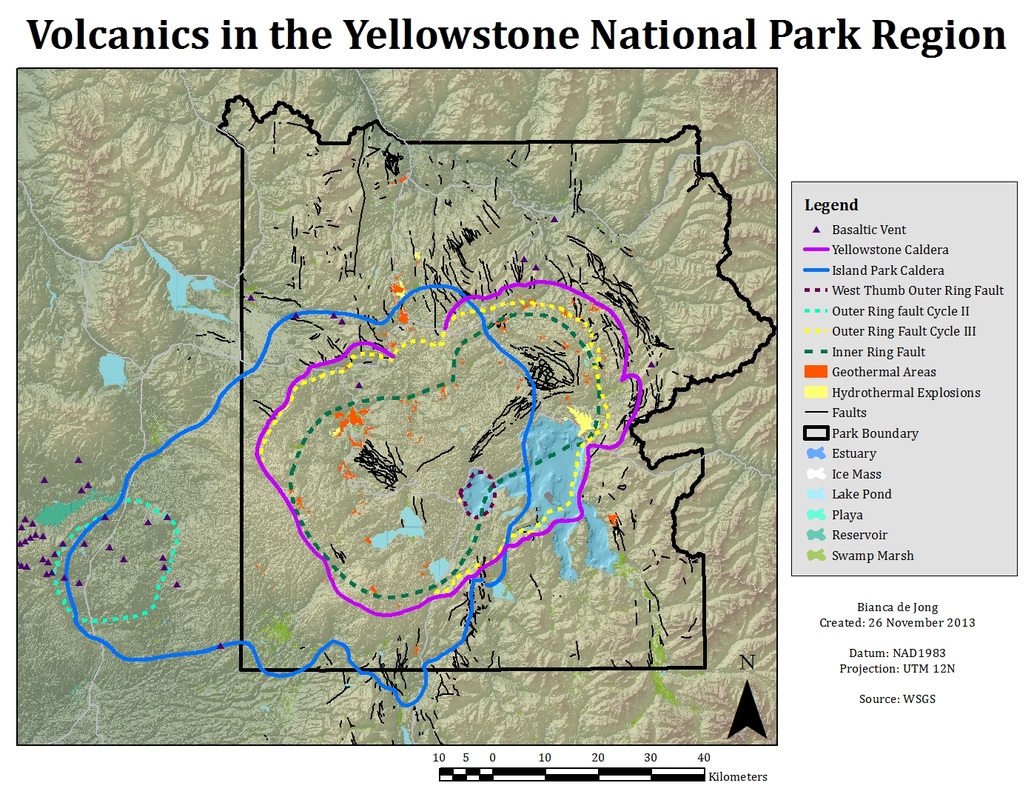
- Volcanics Map
- Geothermal Explosions
- Basaltic eruption and lava flows
- Pyroclastic air fall dispersal for a caldera forming eruption
- VORIS tool air fall dispersal
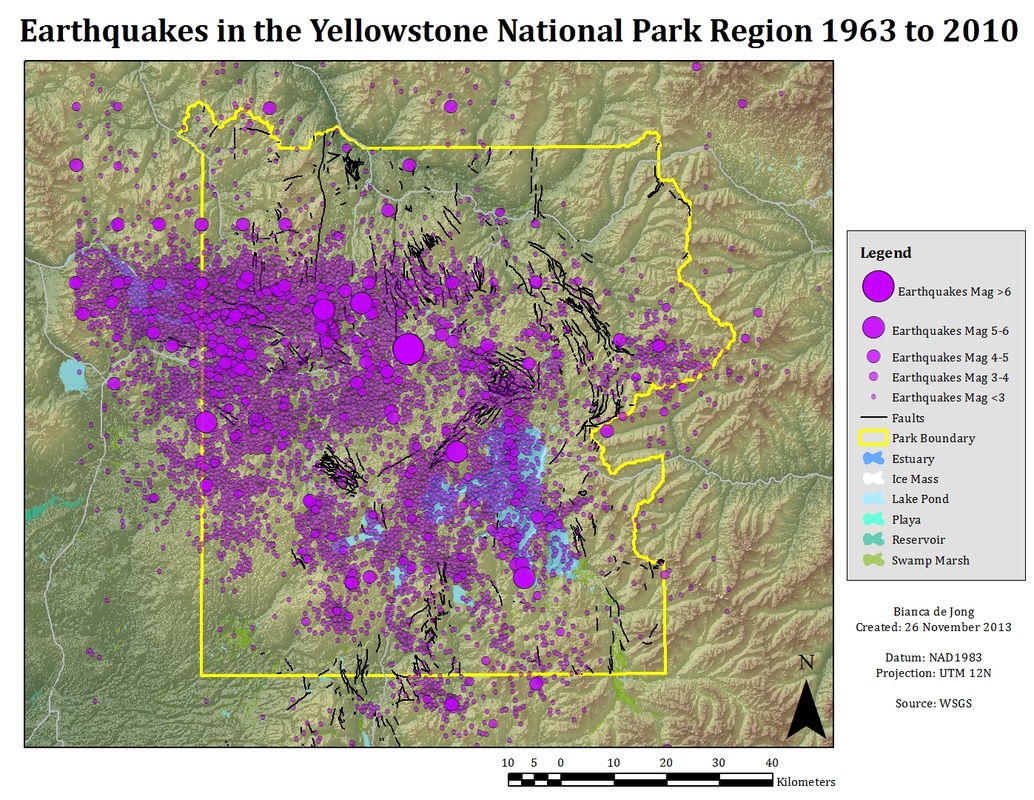
Historic Earthquake Distribution Map
The WSGS had shapefile data representing earthquakes in the Yellowstone National Park area from 1963 to 2010, this data was used to produce a map that displays the historic earthquakes highlighting the different magnitudes by using points of increasing size to mimic the increasing magnitude of the earthquakes.
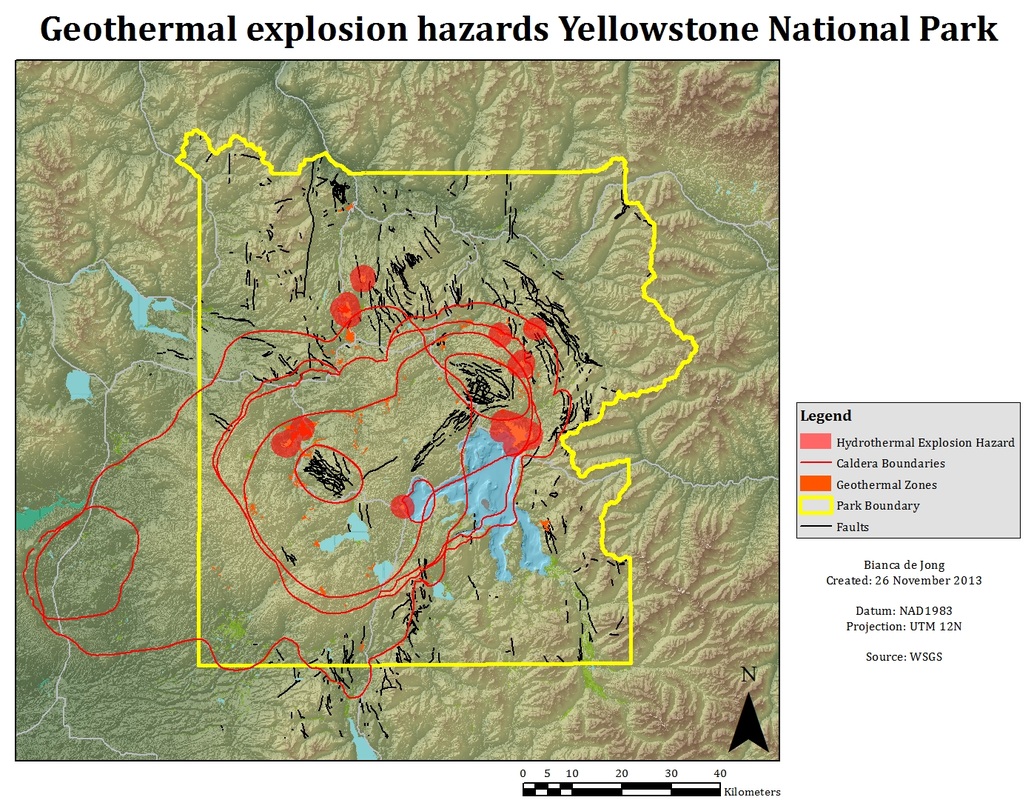
Geothermal Explosion Hazard Map
Christiansen, et al. (2007) discuss the hazards associated with hydrothermal explosions and suggest that rocks can be thrown up to 2000 meters from a hydrothermal explosion crater. Hydrothermal craters were established from surficial geology data, the polygons were selected and a new layer was created from the selections. A buffer of 2000 m was created around the areas of previous hydrothermal eruption highlighting areas which could be affected by these hazards.
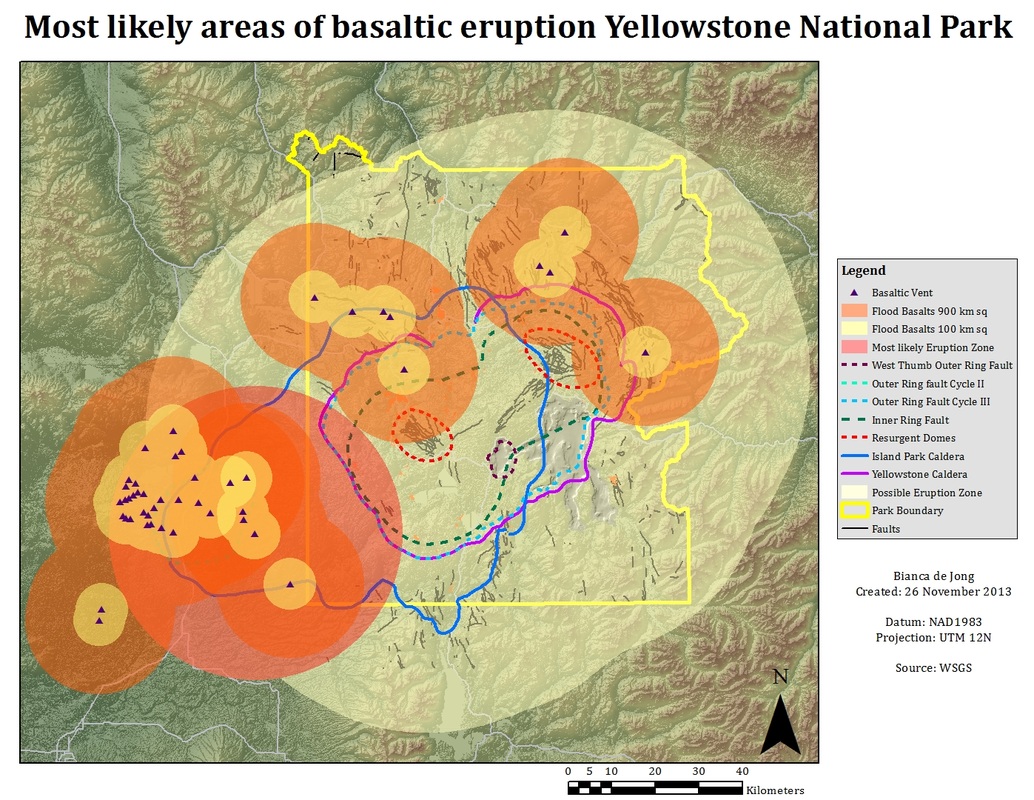
Basaltic Eruption Hazard Map
Basaltic eruptions in the Yellowstone National Park are most likely to occur in the Island Park Caldera Basin (Christiansen et al. 2007). This is based on a concentration of basaltic vents and previous basaltic lava outflow deposits found in the area. However Christiansen et al. (2007) state that future basaltic eruptions could occur anywhere in a band 40 km wide surrounding the Yellowstone Caldera. To emulate this a 40 km buffer was created around the Yellowstone Caldera showing areas where an eruption could occur. The largest flood basalt to occur from a basaltic vent at Yellowstone National park was approximately 900 square km and the second largest was approximately 100 square km (Christiansen et al. 2007). To map this hazard the 900 sq km and 100 sq km areas were used to establish the maximum area affected. A buffer of 17 km and 6 km was created around known basaltic vents.
|
100 km2 = π r2
100 km2/ π = r2 r = 6 km |
900 km2 = π r2
900 km2/ π = r2 r = 17 km |
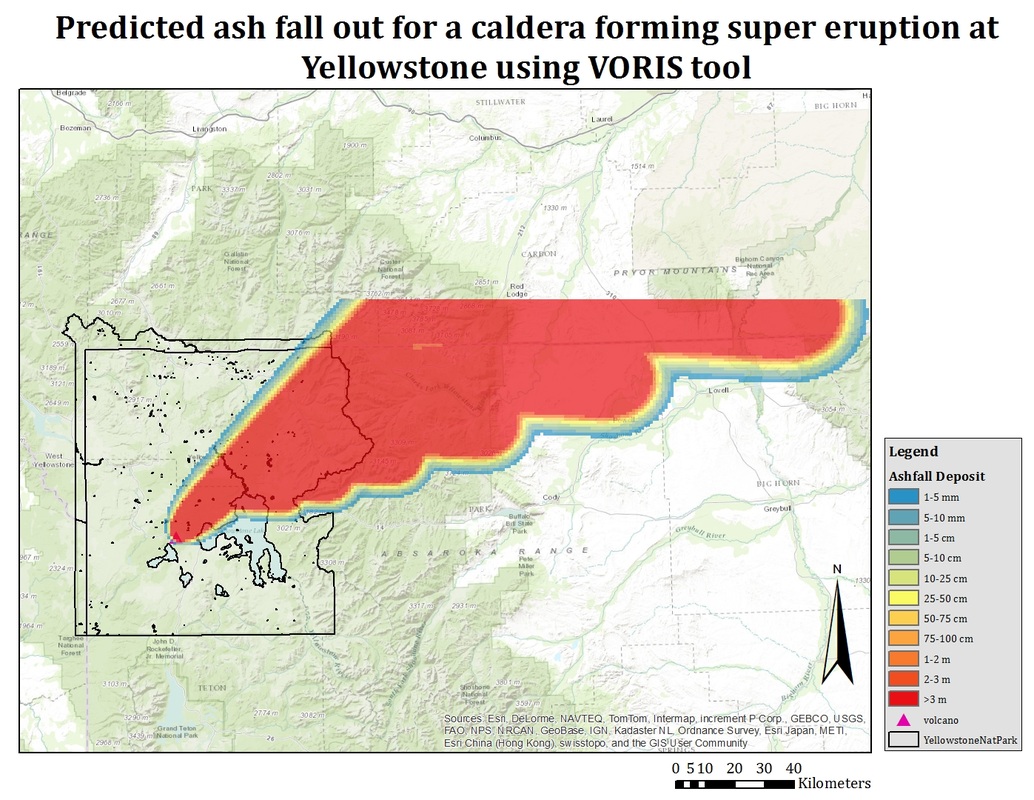
Pyroclastic air fall deposits - VORIS tool
|
Using the VORIS tool, the parameters associated with air fall dispersal are displayed in figure 3. The particle density, air density and air temperature parameters were predetermined by the tool, however all the other parameters could be specified in relation to a specific eruption scenario. Figure 3 is populated with the exact parameters used to map a caldera forming eruption at Yellowstone. The figures were chosen based on research of previous caldera forming eruptions at Yellowstone, from ultra plinian definitions (figure 4) and local prevailing wind information (figure 5).
Particles sizes were based on geologically standardized size fractions associated with air fall tephra out lined in the table below.
|
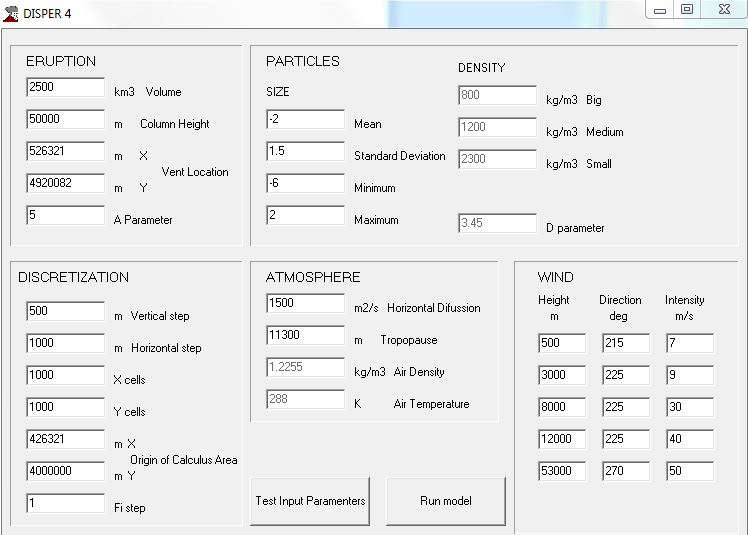
Figure 3: Air fall dispersal parameters in VORIS tool
The vent location used was a central point in the Yellowstone Caldera. In reality a caldera forming eruption would have multiple vents erupting material, however the VORIS tool only allowed one vent location.
The map produced using the VORIS tool did not correctly compare to other air fall tephra maps displaying dispersal of similar tephra volumes. For this reason another air fall tephra dispersal map was produced that better displayed the extremely wide spread extent predicted for a VEI 8 caldera forming eruption. |
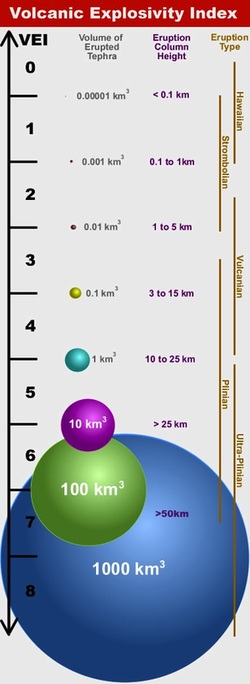
Figure 4: Volcanic Explosivity Index
|
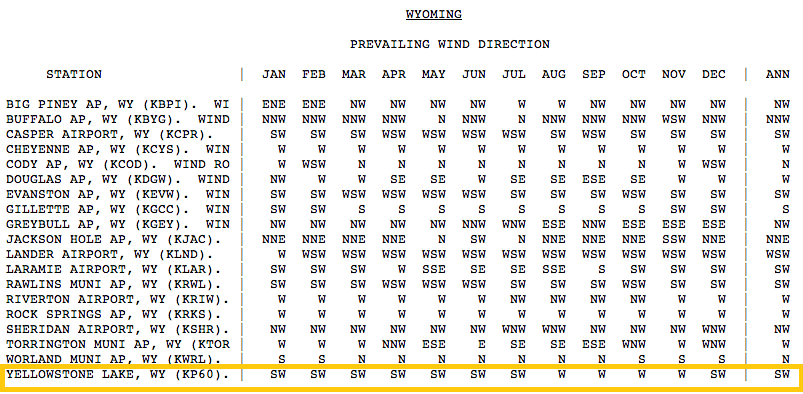
Figure 5: Monthly and annual average prevailing wind direction for Wyoming
|
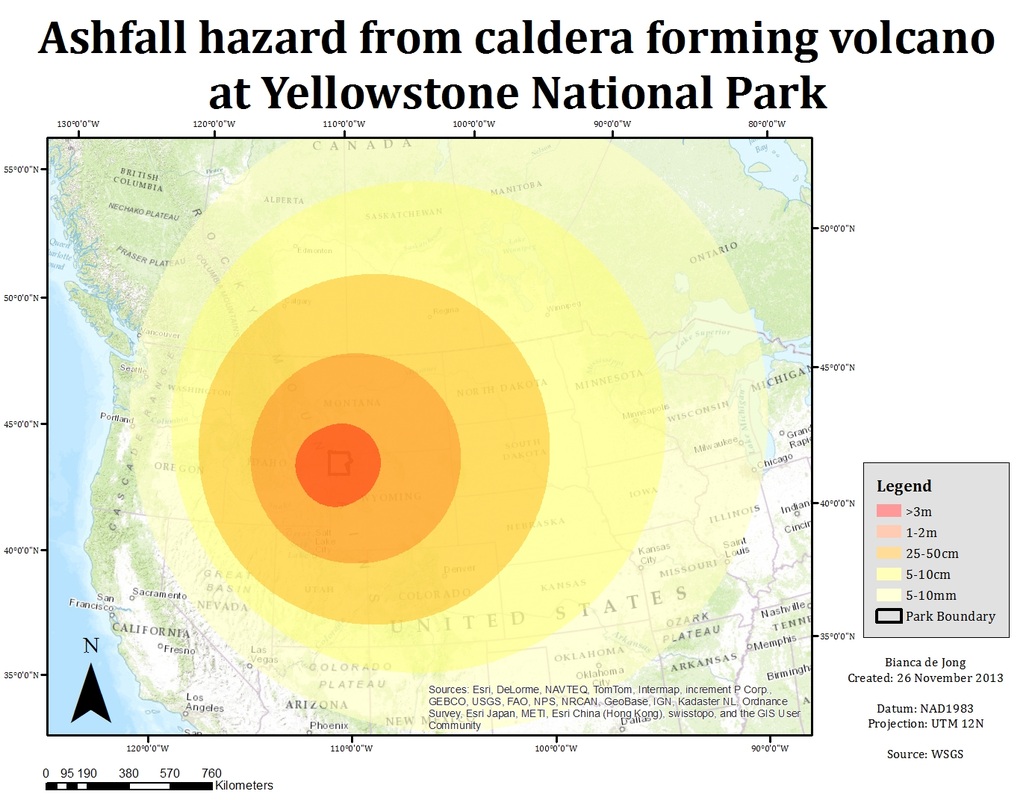
Pyroclastic air fall deposits - Buffers
It is predicted that the area 100 miles from the site of eruption will be the most intensely affected by pyroclastic air fall tephra (Montana DES, 2010). The large scale of such dispersal meant that the DEM created for the other maps was not large enough to display the large volumes of ash fall tephra. A topographic map of the North Western United States was used as a base map and a 100 mile buffer was created around the Yellowstone Caldera to display the area most severely affected, predicting a fall out thickness of > 3 meters. Four points were added to the map using the editor tool, trending in a south westerly direction and buffers of 300 miles, 500 miles, 700 miles and 900 miles were created displaying decreasing thicknesses of fall out affected by the south westerly wind direction characteristic of the Yellowstone region.
Final Hazard Map
To produce the final hazard map, each hazard layer was added to the Yellowstone DEM, this map can be seen on the Maps page.
