Limitations
|
The VORIS tool was designed to be used with ArcGIS 9.2 making it difficult to run in 10.1 this meant that the tool was unable to be used to it's full potential. The lava flow tool was unable to locate the DEM within ArcGIS 10.1 which is a major requirement for producing a correct layer as the tool uses the DEM to mimic the flow of topography (figure 1).
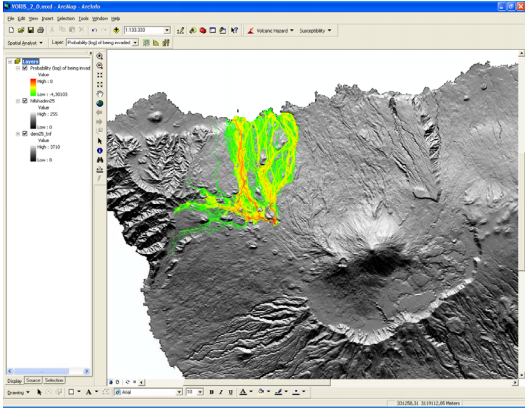
Figure 1: Example of lava flow simulation using VIRIS tool
The VORIS tool should have produced a map displaying 11 layers of differing ash thicknesses as shown in figure 2 using test parameters. When parameters established for a Yellowstone caldera forming eruption were input, the VORIS tool was unable process such large volumes of ash (2500 cubic km) to heights of 50,000 km and produce a viable map (figure 3). For this reason the results from the VORIS simulation tool were not used. The tool was able to simulate the wind directions which effect the dispersion of ash, however the tool was unable to correctly display the large distribution of air fall particles at continental scales. Alternatively buffers were used to gauge approximate ash fall distribution across the North West United States and beyond, creating a map that better represented the ash distribution produced by a series of high volume eruptions.
|
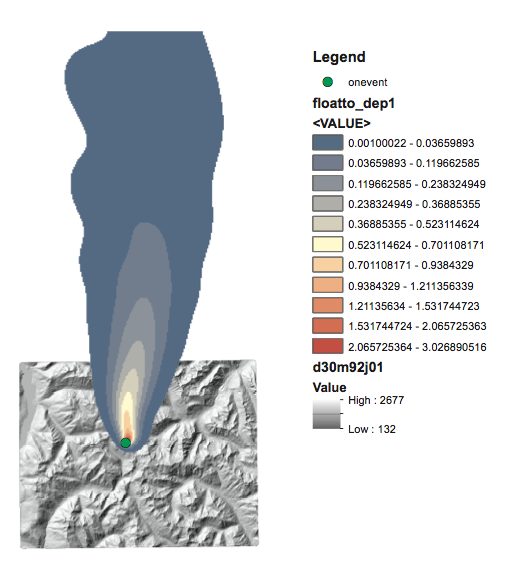
Figure 2: VORIS test ash fall simulation
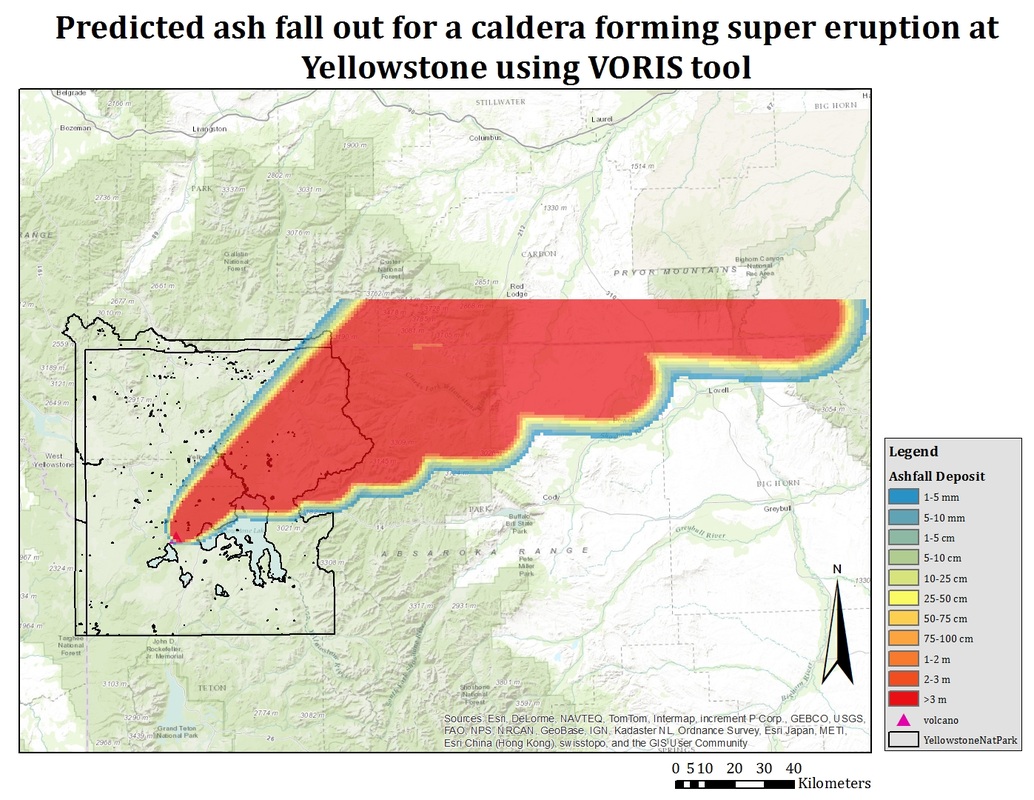
Figure 3: Map produced using parameters for a Caldera forming volcanic eruption at Yellowstone using the VORIS tool.
|
The shear scale of the Yellowstone Volcanic Area made it difficult to pin point areas of hazard initiation such as a single vent which is easily located or assumed in a strato volcano scenario. Also the wide ranging volcanic hazards in terms of both type and size makes it difficult to produce just one hazard map, if all of the hazards had have been documented in this report the entire 8,987 square kilometer area and a large proportion of the surrounding area would have been classed as high risk for at least one if not multiple hazards.
